I’ve just found this site which has info on how to implement various math functions in programming. I’d definitely recommend going through it after finding out what a Taylor series is (via Khan Academy) if you don’t already know.
Category Archives: math
A quick update
I haven’t been updating this blog very much recently so I’ve decided to start a series of small but frequent posts that will contain little things I’ve found that proved to be useful. These will probably mostly contain links to stuff. Any ways, here‘s the link for this quick update. It’s for a very useful site for learning math that can help with engineering.
A tutorial on Maxima
I’ve recently found out about a programming language called “Maxima”.
Maxima is a computer algebra system, which means that it can do algebra (as well as many other kinds of Math) for you. Here is a tutorial on how to use it.
Note that I admittedly haven’t read the tutorial as I already know how to use Maxima, but the tutorial is on its sourceforge page so I’m just going to trust it.
The Method of Least Squares
Recently I got into an on-line “debate” (yes I know, I should have known better, but let’s make this a learning experience for all; shall we?) about the world population. This got me thinking about how useful it would be to show people about “the method of least squares”.
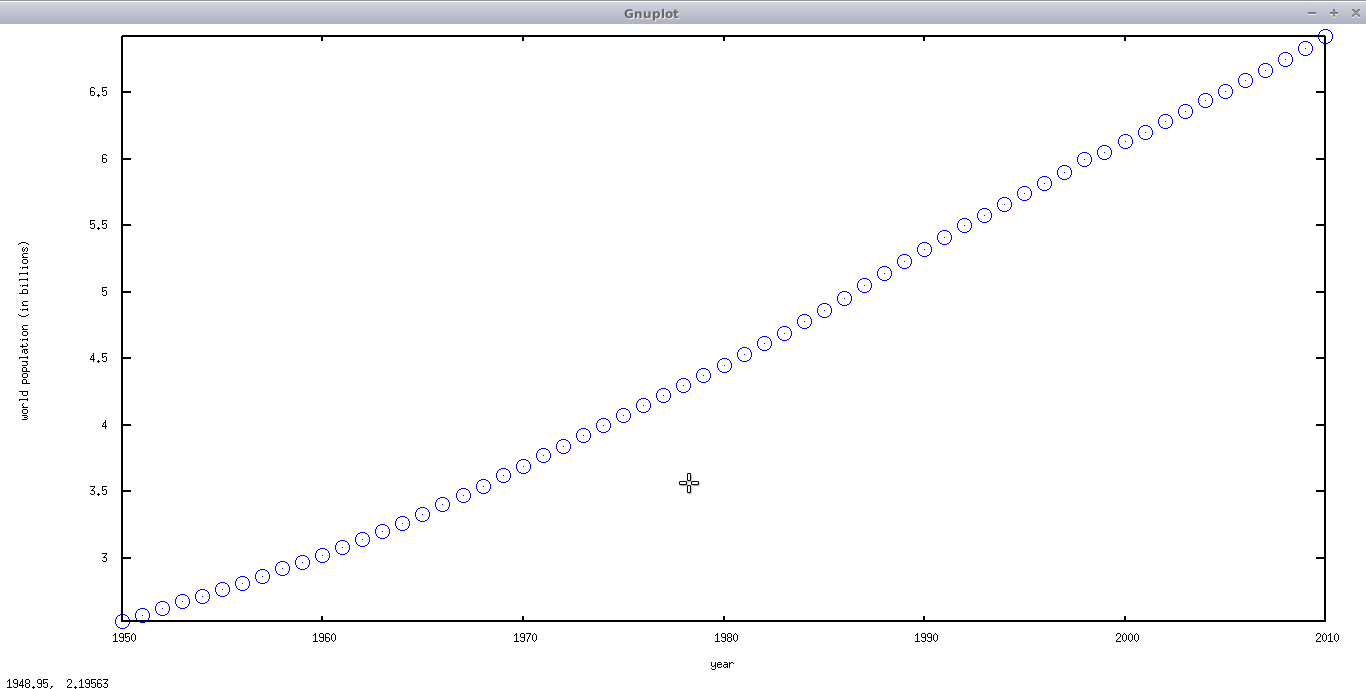
The method of least squares is a mathematical tool used for analyzing scientific data. Here’s how it works: First we take our scientific data. This data could have come from any number of sources. Perhaps it came from some sensor that is used to measure something in a scientific experiment, or perhaps it is just some statistical data about the population; like this chart I made from data I got from here:

Now it has been claimed before that the world population is going up exponentially, and who are we to argue with that? Besides it looks kind of like the beginning of exponential growth.
This means that the formula for the world population at any given time will look something kind of like this:
![]()
Where y is the world population, x is the year, and a, b, and c are some kind of number that we don’t know the values of. Now what if we wanted to predict what the world population will be in the future?
Obviously we need a formula, and obviously we need to find out what a, b, and c are.
Let’s look at that graph again:

Did you notice how it’s all bumpy and not a nice smooth curve like this one?

It seems reality doesn’t like making things nice and simple. The people who were finding this world population data probably made a few mistakes. Maybe some people lied on their tax forms (which is probably how they got much of this data) at certain points when their economies were bad, or maybe some people were accidentally counted twice.
In other words these results have some random error in them. This is unfortunately a problem that you face whenever you measure anything: you’re going to get inaccurate results. Whether you’re measuring world population, the charge on fundamental particles, or just distances with a ruler; the result will always be slightly off.
As technology improves measurement tools get more accurate, and don’t introduce as much error, but scientists still have to find some way to deal with this.
So how does one deal with this?
First what we do is take a formula that makes a graph that we think looks like our data. In this case it’s a second degree polynomial; AKA this thing:
![]()
Now let’s replace a, b, and c with the Greek letter beta (because this will separate the true math nerds from the fakers). So it’ll look like this:

This way we can maybe we can use this for other crazy formulas in the future like:
What we want to do is find the values of the betas this formula,

fit the data as closely as possible. So what we could do this for every data point:
![]()
In other words, every point in that graph is a pair of x and y values. For each one we take the y value, and subtract this from it
![]()
Where x is the x value for that particular pair. This way we’ll find the difference from the value that our theoretical formula gives us, and the actual value from the data. The trick here is to find the beta values that minimize the difference between the theoretical value and the actual value.
If we do this subtraction and squaring for every data point (or more realistically: have a computer do it for us), and add them all up we might end up with something that looks like this horrible mess:

Not only does this give us what will be the error in our formula, but it’s also the phone number of Satan.
Now we can use calculus and algebra to find out what the betas should be. First we need
to take derivatives with respect to each of the beta variables (here‘s a bunch of Khan Academy videos on how to take derivatives, and what derivatives are. Be sure to look for the videos talking about some rule (like the “exponent rule”, or the “chain rule”)).
Next we set all those derivatives equal to zero.
In this case it’ll look like this crime against nature:

And yes this will be on the final exam (of your existence).
Next we can use back substitution to find out what the values are. Then that’s it! We’re done! And to think I’ve probably only lost two thirds of my audience when I showed the first picture!
![]()
This formula will tell us the World population (in billions) at any given time ‘x’. Where ‘x’ is the year.
We can then use the quadratic formula to find out when the we will go extinct from overpopulation!
